CPU Challenges
Study Roadmap for CPU in Linux
Exercise 1: Monitor Basic CPU Usage
- Objective: Get a baseline of your system's CPU performance.
- Tools:
top,htop - Instructions:
- Run
toporhtopto monitor real-time CPU usage. - Observe the CPU usage per core and the load average.
- Record metrics over a period of time and identify any trends.
- Run
Notes:
- Running
topgives us some interesting information
Tasks: 132 total,   1 running, 131 sleeping,   0 stopped,   0 zombie
%Cpu(s):  1.5 us,  3.0 sy,  0.0 ni, 95.5 id,  0.0 wa,  0.0 hi,  0.0 si,  0.0 st
MiB Mem :   3910.6 total,   1062.8 free,    334.9 used,   2512.9 buff/cache
MiB Swap:      0.0 total,      0.0 free,      0.0 used.   3383.7 avail Mem
- The total amount of processes in the machine - and even separated by status
- The CPU % usage spliited by `user, system, ni(user defined priorities),idle %, waiting-time (for IO), hi (time for hardware handling CPU time), si (code calling interruption), st (stolen machine - involuntary wait due to hypervisors)
- Memory and Swap Memory. Reference: https://unix.stackexchange.com/questions/18918/linux-top-command-what-are-us-sy-ni-id-wa-hi-si-and-st-for-cpu-usage
- Running
htopgives us almost the same inputs but with better visibility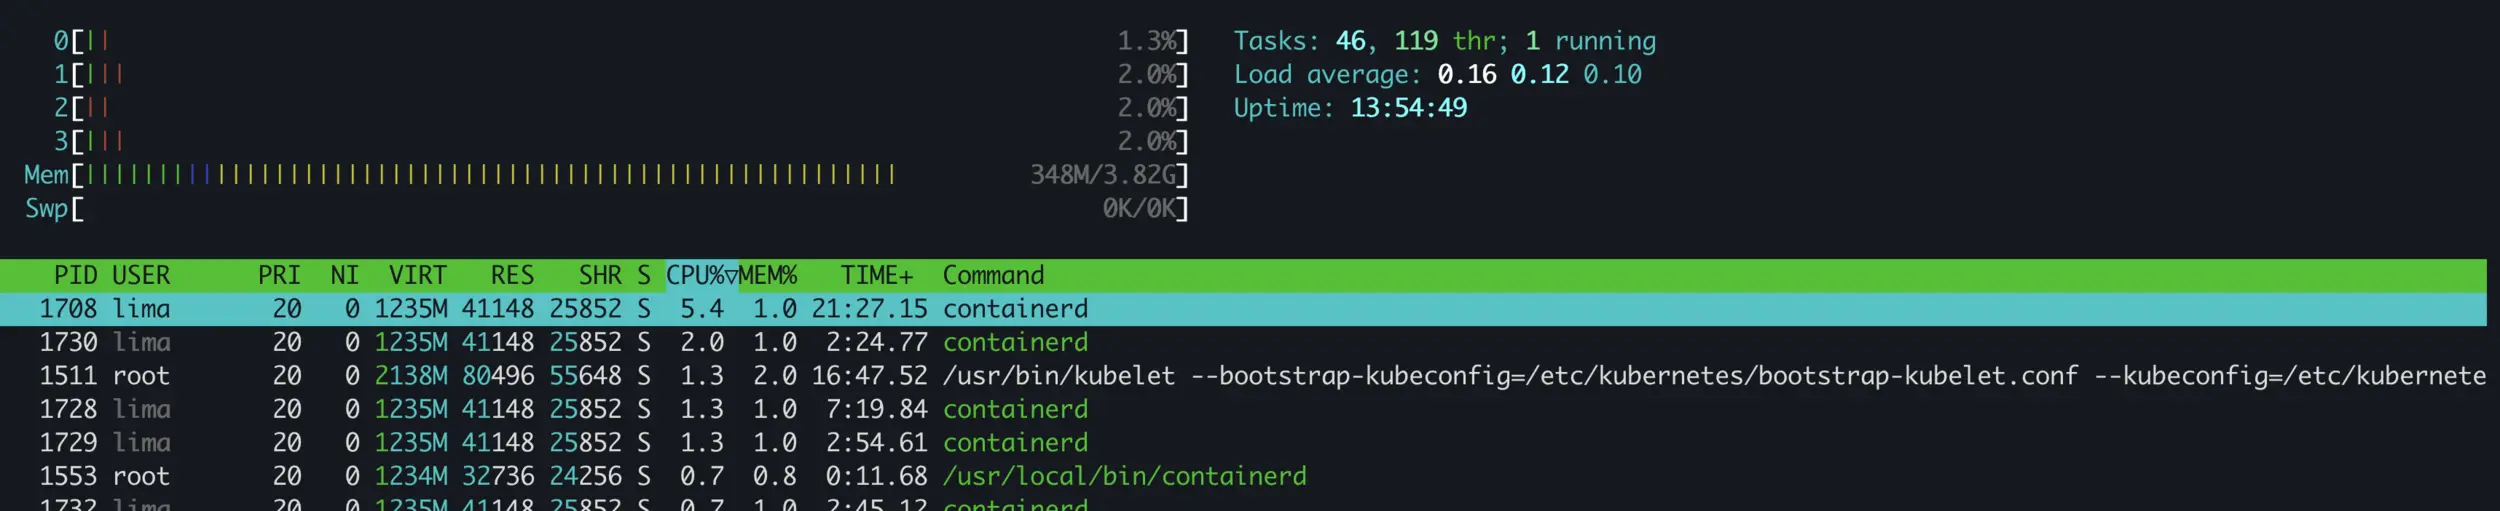
Exercise 2: Analyze Process CPU Usage
- Objective: Understand which processes are consuming CPU resources.
- Tools:
ps,top - Instructions:
- Use
ps aux --sort=-%cputo list processes sorted by CPU usage. - Identify the top CPU-consuming processes.
- Use
topto see dynamic changes in CPU usage and how processes behave over time.
- Use
Notes:
- Running
pshas some cool utilities such as--sort- We can sort for a bunch of parameters - like pid, name, user, %cpu and commad. All the headers form the raw command.
- You can also list only processes for certain users using
ps aux -U <user_ids_by_comma> - reference: https://www.oreilly.com/library/view/linux-shell-scripting/9781785881985/a82f2295-70b5-4bc9-a401-87df782ceafb.xhtml#:~:text=The%20%2Dsort%20parameter%20forces%20ps,%2C%2Bparameter2%2Cparameter3..
ps auxis an BSD acronym to run witha,u,xparametersais for all usersudetailed info
- Given this you can run
ps -u <username or id> uto run all detailed info for only a certain user, apply--sortand much more
Exercise 3: Measure CPU Performance with mpstat
- Objective: Get detailed CPU statistics over time.
- Tools:
mpstat - Instructions:
- Run
mpstat -P ALL 1to monitor CPU usage by each core. - Observe idle time, user time, and system time across different cores.
- Analyze how CPU usage changes during different workloads.
- Run
Note
- Running
mpstat -P ALL 1lists CPU usage per core each 1s
Exercise 4: Perform CPU Stress Testing
- Objective: Simulate high CPU load and observe system behavior.
- Tools:
stress,stress-ng - Instructions:
- Use
stress --cpu 4 --timeout 30to create CPU load on 4 cores for 30 seconds. - Monitor the impact on system responsiveness and CPU metrics using
htoportop. - Experiment with different numbers of CPU cores and durations.
- Use
Exercise 5: Analyze CPU Scheduling with perf
- Objective: Gain insights into scheduling events and CPU performance.
- Tools:
perf - Instructions:
- Run
perf topto see a real-time view of CPU usage by functions. - Run
perf record -afollowed by a workload (e.g., astresstest). - Use
perf reportto analyze which functions were consuming the most CPU cycles.
- Run
Notes:
Running perf top gives us some cool insights into the usability. I've ran it while stress-ng --cpu 1 --timeout 30 was active.
What we could learn from the input is:
  64.40%  swapper          [kernel.kallsyms]         [k] default_idle_call
   6.24%  stress-ng        libm.so.6                 [.] 0x0000000000053e78
   5.90%  stress-ng        stress-ng                 [.] 0x0000000000122288
   1.67%  stress-ng        stress-ng                 [.] 0x000000000012228c
   1.62%  stress-ng        libm.so.6                 [.] __sqrtl_finite
   1.42%  swapper          [kernel.kallsyms]         [k] __softirqentry_text_start
   1.34%  stress-ng        libm.so.6                 [.] 0x0000000000053e7c
   0.77%  sshfs            [kernel.kallsyms]         [k] __wake_up_common_lock
   0.59%  perf             [kernel.kallsyms]         [k] __wake_up_common_lock
   0.52%  swapper          [kernel.kallsyms]         [k] do_idle
   0.47%  swapper          [kernel.kallsyms]         [k] cpuidle_idle_call
The swapper process is responsible for making the CPU idle. In this case, 64% of the time CPU was idle.
To understand how much CPU % a process is using, we need to sum all the entries of it. For stress-ng it is around ~15%.
We can notice that libm.so.6 is the main culprit of load - with an function call named __sqrtl_finite. We are assuming this since we don't have enough info about the code.
Exercise 6: Investigate Context Switching
- Objective: Understand how context switching affects CPU performance.
- Tools:
pidstat,vmstat - Instructions:
- Run
pidstat -w 1to monitor context switches for processes. - Use
vmstat 1to observe context switches at the system level. - Identify processes with high context switch rates and analyze their behavior.
- Run
Exercise 7: Examine CPU Core Affinity
- Objective: Learn how CPU affinity affects performance.
- Tools:
taskset,htop - Instructions:
- Use
tasksetto run a CPU-bound process on a specific core (e.g.,taskset -c 0 ./your_program). - Monitor CPU usage in
htopto see how it behaves when pinned to a single core. - Experiment with different core affinities and observe performance changes.
- Use
Exercise 8: Investigate CPU Thermal Throttling
- Objective: Understand how thermal throttling affects CPU performance.
- Tools:
lm-sensors,cpufrequtils - Instructions:
- Install
lm-sensorsand configure it to monitor CPU temperatures. - Run a stress test while monitoring temperature and CPU frequency.
- Observe how high temperatures lead to throttling and impact performance.
- Install
Exercise 9: Analyze CPU Load Balancing
- Objective: Study how the Linux scheduler balances CPU loads.
- Tools:
sar,htop,dstat - Instructions:
- Use
sar -P ALL 1to monitor CPU usage across cores. - Run workloads that generate different levels of CPU usage.
- Observe how the scheduler redistributes workloads among CPU cores.
- Use
Exercise 10: Long-term CPU Monitoring and Reporting
- Objective: Set up a system to collect and analyze CPU statistics over time.
- Tools:
sar,sysstat - Instructions:
- Install
sysstatand enable data collection. - Use
sar -u 1to collect CPU usage statistics over time. - Analyze the collected data to identify trends, peak usage times, and potential bottlenecks.
- Install
Final Thoughts
Make sure to document your findings, observations, and any surprising results for each exercise. This structured approach will help you develop a comprehensive understanding of CPU performance and scheduling in Linux, allowing you to effectively analyze and optimize CPU-related issues in your system. Enjoy your studies!
Advanced Section
Challenge 1: Analyze Multi-threaded Performance
- Objective: Measure the performance impact of multi-threading on CPU utilization.
- Instructions:
- Create a multi-threaded application that performs heavy computations.
- Use
perfto analyze CPU cycles, cache hits/misses, and context switches. - Compare the performance with a single-threaded version.
Challenge 2: Investigate CPU Cache Effects
- Objective: Understand how cache levels (L1, L2, L3) affect performance.
- Instructions:
- Write benchmarks to access data in different cache levels (e.g., large arrays).
- Use
perfto measure cache hits and misses. - Analyze how data locality impacts performance.
Challenge 3: Measure Context Switch Overhead
- Objective: Analyze the overhead of context switching on system performance.
- Instructions:
- Create a scenario with high context switching (many short-lived processes).
- Use
pidstatto measure context switches per second. - Compare CPU utilization with and without context switch-heavy workloads.
Challenge 4: Explore CPU Scheduling Algorithms
- Objective: Compare different CPU scheduling algorithms (CFS, real-time).
- Instructions:
- Create workloads that require real-time processing.
- Switch between scheduling policies using
chrtandnice. - Measure performance impacts on latency and throughput.
Challenge 5: Simulate CPU Contention
- Objective: Observe the effects of CPU contention on performance.
- Instructions:
- Run multiple CPU-intensive processes on the same CPU core.
- Monitor CPU usage and process states with
toporhtop. - Analyze the impact of contention on overall system performance.
Challenge 6: Investigate Power Management
- Objective: Understand how CPU power management affects performance.
- Instructions:
- Use
cpupowerto change CPU frequency scaling governors (performance, powersave). - Measure performance under different governors using a CPU benchmark.
- Analyze trade-offs between power savings and performance.
- Use
Challenge 7: Explore Hyperthreading Effects
- Objective: Measure the impact of hyperthreading on CPU performance.
- Instructions:
- Enable/disable hyperthreading in your BIOS.
- Run benchmarks on the same workload with hyperthreading on and off.
- Compare CPU utilization and overall performance metrics.
Challenge 8: Analyze CPU Resource Limits
- Objective: Understand the impact of setting resource limits on CPU usage.
- Instructions:
- Use
ulimitto set CPU time limits for processes. - Run a CPU-intensive job and monitor its behavior as it hits limits.
- Analyze how the system handles job termination and resource cleanup.
- Use
Challenge 9: Investigate Real-time Task Scheduling
- Objective: Explore how real-time tasks interact with regular tasks.
- Instructions:
- Create a real-time task using
pthreadand set its scheduling policy. - Run it alongside regular tasks and measure impact on responsiveness.
- Analyze any priority inversion or scheduling anomalies.
- Create a real-time task using
Challenge 10: Profile Application Performance
- Objective: Use profiling to identify bottlenecks in CPU-bound applications.
- Instructions:
- Use
gproforvalgrindwithcallgrindto profile an application. - Analyze the generated reports to find hotspots and optimize the code.
- Measure performance improvements after optimizations.
- Use